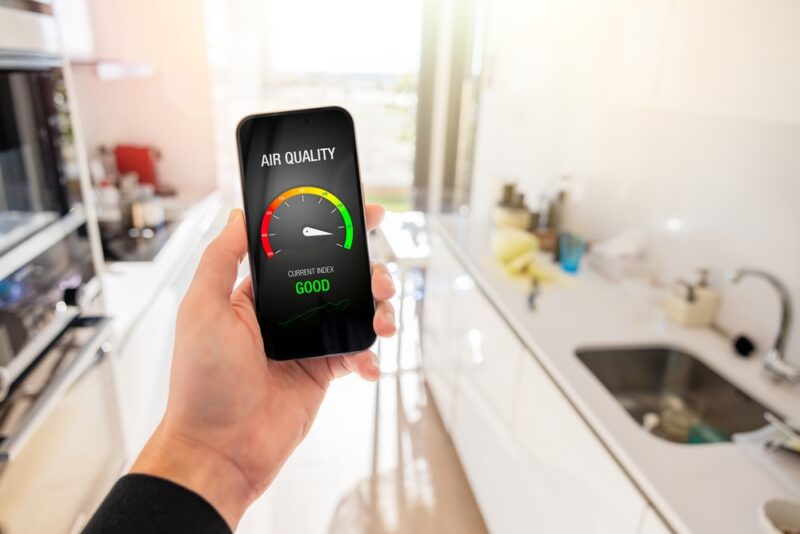
Since June, when smoke from Canadian wildfires first blanketed America, the Air Quality Index (AQI) has become part of the daily national conversation. Until now, checking the AQI has been routine in the parts of the country typically impacted by wildfires, but less so on the East Coast.
It’s not just the wildfire smoke that has people monitoring and discussing air quality regularly. The three-digit temperatures hitting the United States also bring up questions about air quality. We’re all seeking quick sources of information to help navigate potentially unhealthy conditions. Thankfully AQI is an easy check on most phones. For those of us who are new to AQI and don’t fully understand the information being given, or those who want a refresher, here’s a primer:
The Air Quality Index relates essential information about the negative impacts of air pollution, allowing vulnerable groups to protect themselves. It helps people determine when to stay indoors as well as the best time of day to be outside, avoiding or reducing exposure to harmful pollutants. Those most compromised are children, whose lungs are still developing, seniors, and people with lung and respiratory diseases, particularly asthma.
The universal way to demonstrate air quality is a semi-circle dial divided into six sections, using colors to identify risks. They are green, yellow, orange, red, purple, and maroon. Based on an index from zero to 500, the hazards increase as the numbers rise. This visual imagery facilitates easy recognition of conditions, particularly as readings often change throughout the day.
But what do the numbers mean? AQI is essentially a tallied result of five key air pollutants, all of which can impact different demographics. Their combined density yields the conclusive results. They are:
- Particulate Matter—PM 2.5, or soot, and PM 10 are the smallest and largest particles that cause serious health problems when entering the lungs or bloodstream.
- Carbon Monoxide—High amounts reduce the oxygen that can travel to the heart and brain via the bloodstream.
- Ground-Level Ozone—This is particularly hard on those with asthma. Children are at greater threat because they traditionally spend more time outdoors.
- Nitrogen Dioxide (NO2)—Released in the air from burning fossil fuels. Emissions emanate from power plants and the exhaust from cars, buses, and trucks.
- Sulfur Dioxide (SO2)—This also comes from the burning of fossil fuels, primarily from specific industrial facilities and power plants. This is of top concern to children and asthmatics.
A little background: In 1970, the Clean Air Act created standards to control and regulate a range of harmful pollutants. EPA was tasked with setting National Ambient Air Quality Standards (NAAQS). Today, EPA’s air monitoring site, Air Now, is a solid go-to source. You type in your zip code and receive local information first, including specific information about PM 2.5, followed by state, country, and global content.
Air Now is fed figures by a wide range of partners, from top federal agencies like NOAA and NASA to state and tribal agencies. Mexican and Canadian entities are affiliated as well. For beginners, there are plenty of concise directions. Informative links take the guesswork out of any terminology that may be unfamiliar.
An interactive map lets users zoom in to see data at a single air quality monitor or out for a bigger picture. It’s not perfect; some places don’t have air monitors close by. You can check to find the closest monitor to your home, school, or work. For people and groups wanting hyper local data, EPA provides information on siting and installing air sensors with tips on choosing an appropriate location, installation, and documentation.
While there are many home air monitors available on the market, some are considered more accurate than others. If you’re in the market, look for one that has been evaluated by a third party. Some for-profit companies allow customers to share their data on a public website, which can be useful if you live near someone who owns one. Still, not all sensors test for all air pollutants.
If you sign up for Air Now’s EnviroFlash, you’ll receive daily emails advising what to expect. A “Forecast” option can help determine when to run errands or exercise. Ozone is usually lower in the morning. An Environmental Justice Screening and Mapping tool helps people uncover the locations of fossil fuel-driven power plants, toxic trackers, and specific state instruments.
Parents with kids concerned about air quality can check out EPA’s Air Quality Flag program. They have initiatives for children, educators, and schools, such as curriculum projects, activity sheets, lesson plans, and resources available in English and Spanish. Young kids can follow the adventures of Coco the Chameleon as he and his friends learn about air quality.
Checking the AQI daily helps us protect our families and safeguard our health, but it also gives constituents vital data to reference when calling legislators to push for more stringent regulations.
Spread the word about how air quality can impact health in your community with this flier.


